10 years of “Why Sell Now?” Dec 11,
2014
Doug Wakefield
While
finding the end of the largest financial bubble in history has proved very
illusive over the last three years for some of the most seasoned market
technicians in the world, the last fifteen have allowed us to have many
reminders that wild rides to the top have always ended the same.

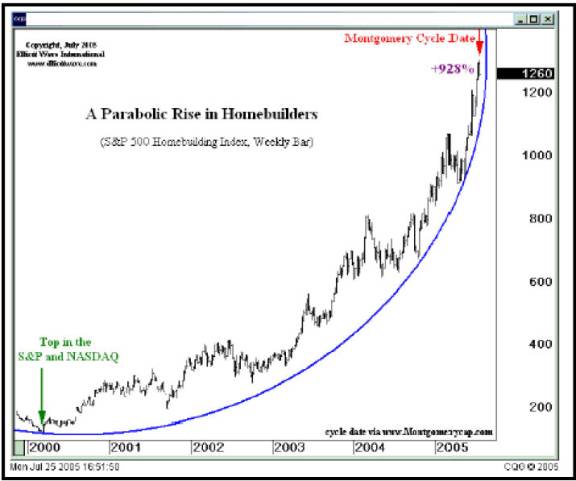
[Chart produced by www.elliottwave.com, Steve Hochberg’s
Short Term Update, in July 2005. This piece of history, along with many market
technicians and historians, can still be found in a free newsletter I released
in July 2005, called Teenage
Investing.]

Anyone
looking at the historical data at the end of 2014, can see that July 2005 was
the last time an “all time high” was
attained in this housing index. This is not an opinion; it is a fact.

[Source
– My public article, Let the Buyer
Beware, July 27 ‘2007]

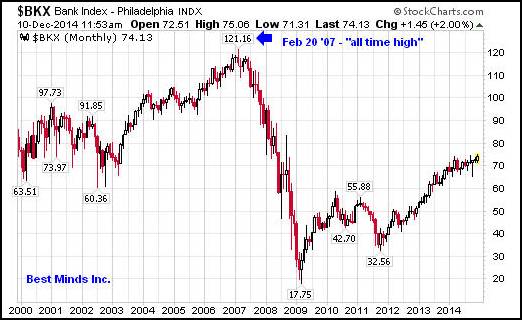
July
2007 wasn’t another period prior to bank stocks soaring to new highs. By that
point, it was an early warning of a depression level collapse.

[Source
– Fear and
Perception, Nov 1, 2007]
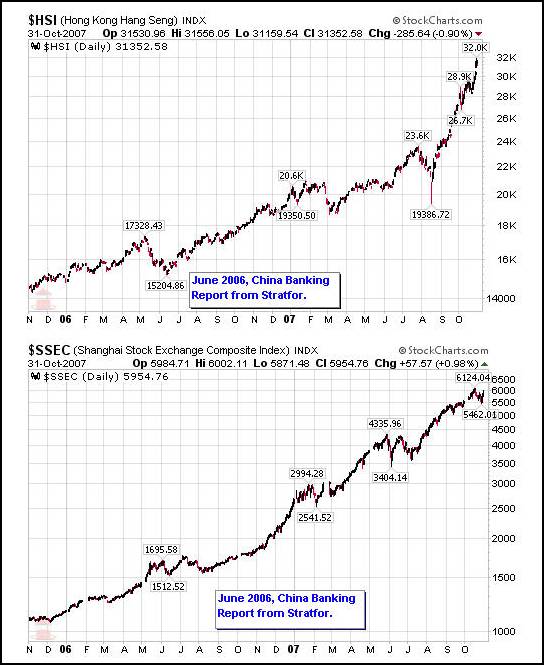
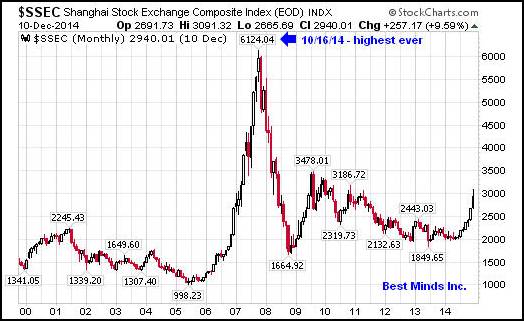
“In January of 2006, investors opened an average of 2,708 brokerage accounts per day. By August of 2007, the average had grown to 450,000 individuals accounts opened per day. Is the difference comprised of individuals who are thoroughly investigating companies' economic fundamentals and the sustainability of their stock prices? Are they seeking to understand when these historic leaps will end, or are they looking for any story that supports the view that China's markets will only go up?” [Fear & Perception, Nov 1 ‘07]


[Source
– The
Gallery of Crowd Behavior Returns – May 2, 2011/ Yes, those misspellings
irritate you!]
“Based
on this information, it would seem extremely important for anyone depending on our
global capital markets to pay attention to trends in the US dollar and Euro.
From looking at the charts below, and once again considering the comments of
Mr. Sperandeo earlier, it would appear that a massive change in direction
should be expected for these two aircraft carriers.” [The Gallery of Crowd Behavior Returns, May 2,
2011]


[Source
– The
Gallery of Crowd Behavior: Goodbye All Time Highs, Oct 30 ‘14]


[Source
– The
Gallery of Crowd Behavior: Goodbye All Time Highs, Oct 30 ‘14]


As
we head for the close of 2014, and looking at current and former rapidly rising
price movements, would one really be all that surprised to find 2015 radically
different from the last few years? Considering how much debt has been created
merely to stall this “all time high” bubble, would we not expect the downside
of financial assets globally to be extremely severe?
Global
Debt Exceeds $100 Trillion as Governments Binge, BIS Says, Bloomberg, Mar 9
‘14
“The
amount of debt globally has soared more than 40 percent to $100 trillion
since the first signs of the financial crisis as governments borrowed to
pull their economies out of recession and companies took advantage of record
low interest rates, according to the Bank of International Settlements.
The
$30 trillion increase from $70 trillion between mid-2007 and mid-2013 compares
with a $3.86 trillion decline in the value of equities to $53.8 trillion in the
same period, according to data
compiled by Bloomberg. The jump in debt as measured by the Basel,
Switzerland-based BIS in its quarterly review is almost twice the U.S.’s gross
domestic product.
Borrowing
has soared as central banks suppress benchmark interest rates to spur growth
after the U.S. subprime mortgage market collapsed and Lehman Brothers Holdings
Inc.’s bankruptcy sent the world into its worst financial crisis since the
Great Depression.….
‘Given
the significant expansion in government spending in recent years,
governments (including central, state and local governments) have been the
largest debt issuers,’ according to Branimir Gruic, an analyst, and Andreas
Schrimpf, an economist at the BIS. The organization is owned by 60 central
banks and hosts the Basel Committee on Banking Supervision, a group of
regulators and central bankers that sets global capital standards.” [italics
mine]
Bank for International Settlements warns on riskier
loan deals, Financial Times, Dec 10, 2014
“Top
central bankers have warned that investors are underestimating the risks in
racier “sliced and diced” loans. European sales of such bundled loans have more
than quintupled over the past year to the highest volume since they were blamed
for sparking a global financial crisis.
The
Bank of International Settlements — dubbed “the central bankers’ bank” — said
riskier subordinated, so-called “mezzanine”, portions of asset-backed
securities are subject to “considerable uncertainty” due to a “cliff effect”
whereby only a small error in projecting potential losses would magnify
their risks substantially, according to a research paper.” [italics mine]
One
thing is for certain. The memory of the 83% decline in the NASDAQ between 2000
and 2002 has long since been forgotten in a world of “money for nothing”.

[Source
– The
Gallery of Crowd Behavior: Goodbye All Time Highs, Oct 30 ‘14]
 "So the Fed kept filling up the punch bowl [referring to the period between 2002
and 2005]. And as opposed to going into inflation of goods prices, it went into
an inflation of asset prices.
That's inflation in the same way, but its not
called inflation. So if the stock market goes up we don't say, 'Oh my god,
there has been inflation', or if housing prices double we don't say 'oh my god,
there has been this enormous inflation', we say, 'How much richer we are!' But
the problem is that we are not richer, it is simply an illusion of
richness." Dave Colander -
Professor of Economics at Middlebury College (Money for Nothing: Inside the
Federal Reserve, minute 59:00)

“But
those who want to get rich fall into temptation and a snare and many foolish
and harmful desires which plunge men into ruin and destruction.” I Timothy 6:9
Complacency Time Has Gone
If
you have no experience in growing money on the deflationary side of an inflated
financial bubble, I cannot think of a better time to subscribe to The
Investor’s Mind. Denial and procrastination are not a plan of action. New
strategies will be needed.
Next
week, I release a new thinking newsletter, The Investor’s Mind: Second
Opinion, Lessons from the last 10 years. Each issue will provide questions
and history most individuals never consider, because deflationary periods have
been experienced so rare for most in the West in the last 40 years.
However, deflation changes everything once the illusion of the latest inflated
bubble burst.
The
information is designed to benefit both group and individual planning.
The
issues we are facing are far larger than trading or investing. In each issue, I
will refer back to my public and private writings over the last decade. It has
been quiet a ride, with so much great material from many incredible people and
sources. Based on the many “first in history” events we have seen, and will
continue seeing”, I can not think of a more critical time to challenge the “we
have always done things this way” idea.
Click here to start the
next six months reading both the original version of The Investor’s
Mind (started in Jan ’06),
market sensitive trading reports, and the new version, The Investor’s Mind:
Second Opinion.
Doug
Wakefield
President
Best Minds Inc. a Registered Investment
Advisor
1104
Indian Ridge
Denton,
Texas 76205
Phone
- (940) 591 - 3000
Best Minds,
Inc is a registered investment advisor that looks to the best minds in the
world of finance and economics to seek a direction for our clients. To be a
true advocate to our clients, we have found it necessary to go well beyond the
norms in financial planning today. We are avid readers. In our study of the
markets, we research general history, financial and economic history,
fundamental and technical analysis, and mass and individual psychology.